
For the past year a 2009 Subaru Forester 2.5XT has sat stored at our property. It was my folks and then my younger brother drove…
Author: Jonathan Whiting
I enjoy sharing what I am learning and hopefully it's of interest and help to you. I live in Canada with my wife. Follow me on Twitter.
Off-roading terms and definitions

Often confused and misused – Here is a list of the most common off-road terms and definitions for your reading pleasure. Off-road \ ˈȯf-ˈrōd \…
Honda CB500/550 and the soul of Honda 1971-1978
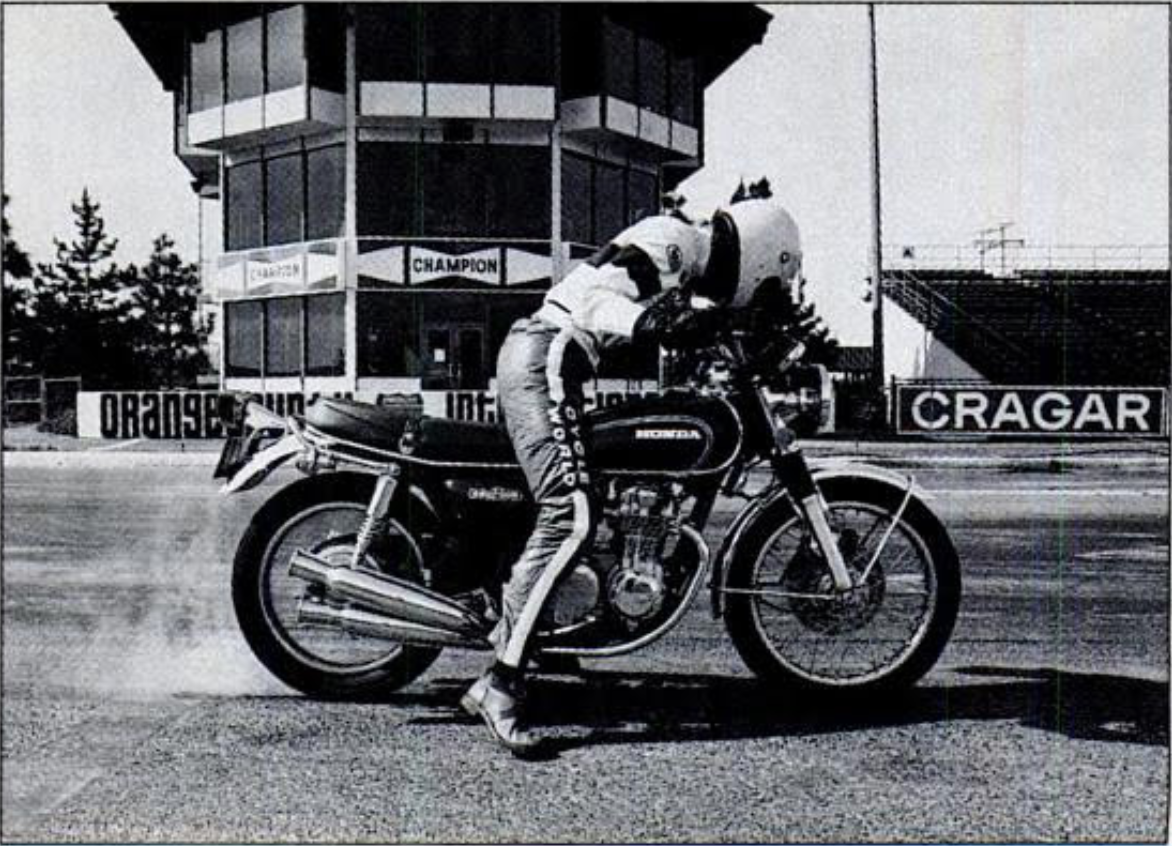
In 1974, Cycle World Senior Editor D. Randy Riggs prepares to launch the Honda CB550 at the now defunct Orange County International Speedway
Recently I’ve become fascinated by the story of Honda’s CB500 and CB550, having recently acquired one. Read reviews and road tests of either bike and…
The 1970s Honda CB-550 sport bike and the surprising parallels with the Porsche 911
In the dead of winter I purchased a 45 year old motorcycle. My neighbour helped me pull it out of my snow shovelled trailer. An…
The truth about burnout

It was a bright sunny day. Sitting at my birch wood table overlooking the back yard, I could the see the light streaming in to…
Migrating PHP and Apache to latest Mac OS after update
After upgrading you MacOS, you will need to reconfigure your MAMP server. Fortunately, it’s pretty easy to do. However, sometime hiccups happen. Here’s a quick…
Maintaining Vision

500,000 visitors, wow. It’s been a journey. Thank you! When it comes to building a business or starting a venture, what is vision? What does…
2018 Okanagan Race/Ride Calendar

Okanagan + Surrounding Areas Knox Mnt Hill Climb Tuesday, May 15 2018 Distance: 3k Start: 6:40pm, registration opens at 5:30pm Cost: $5 + BC race…
How accurate is Zwift’s power estimate for classic trainers?
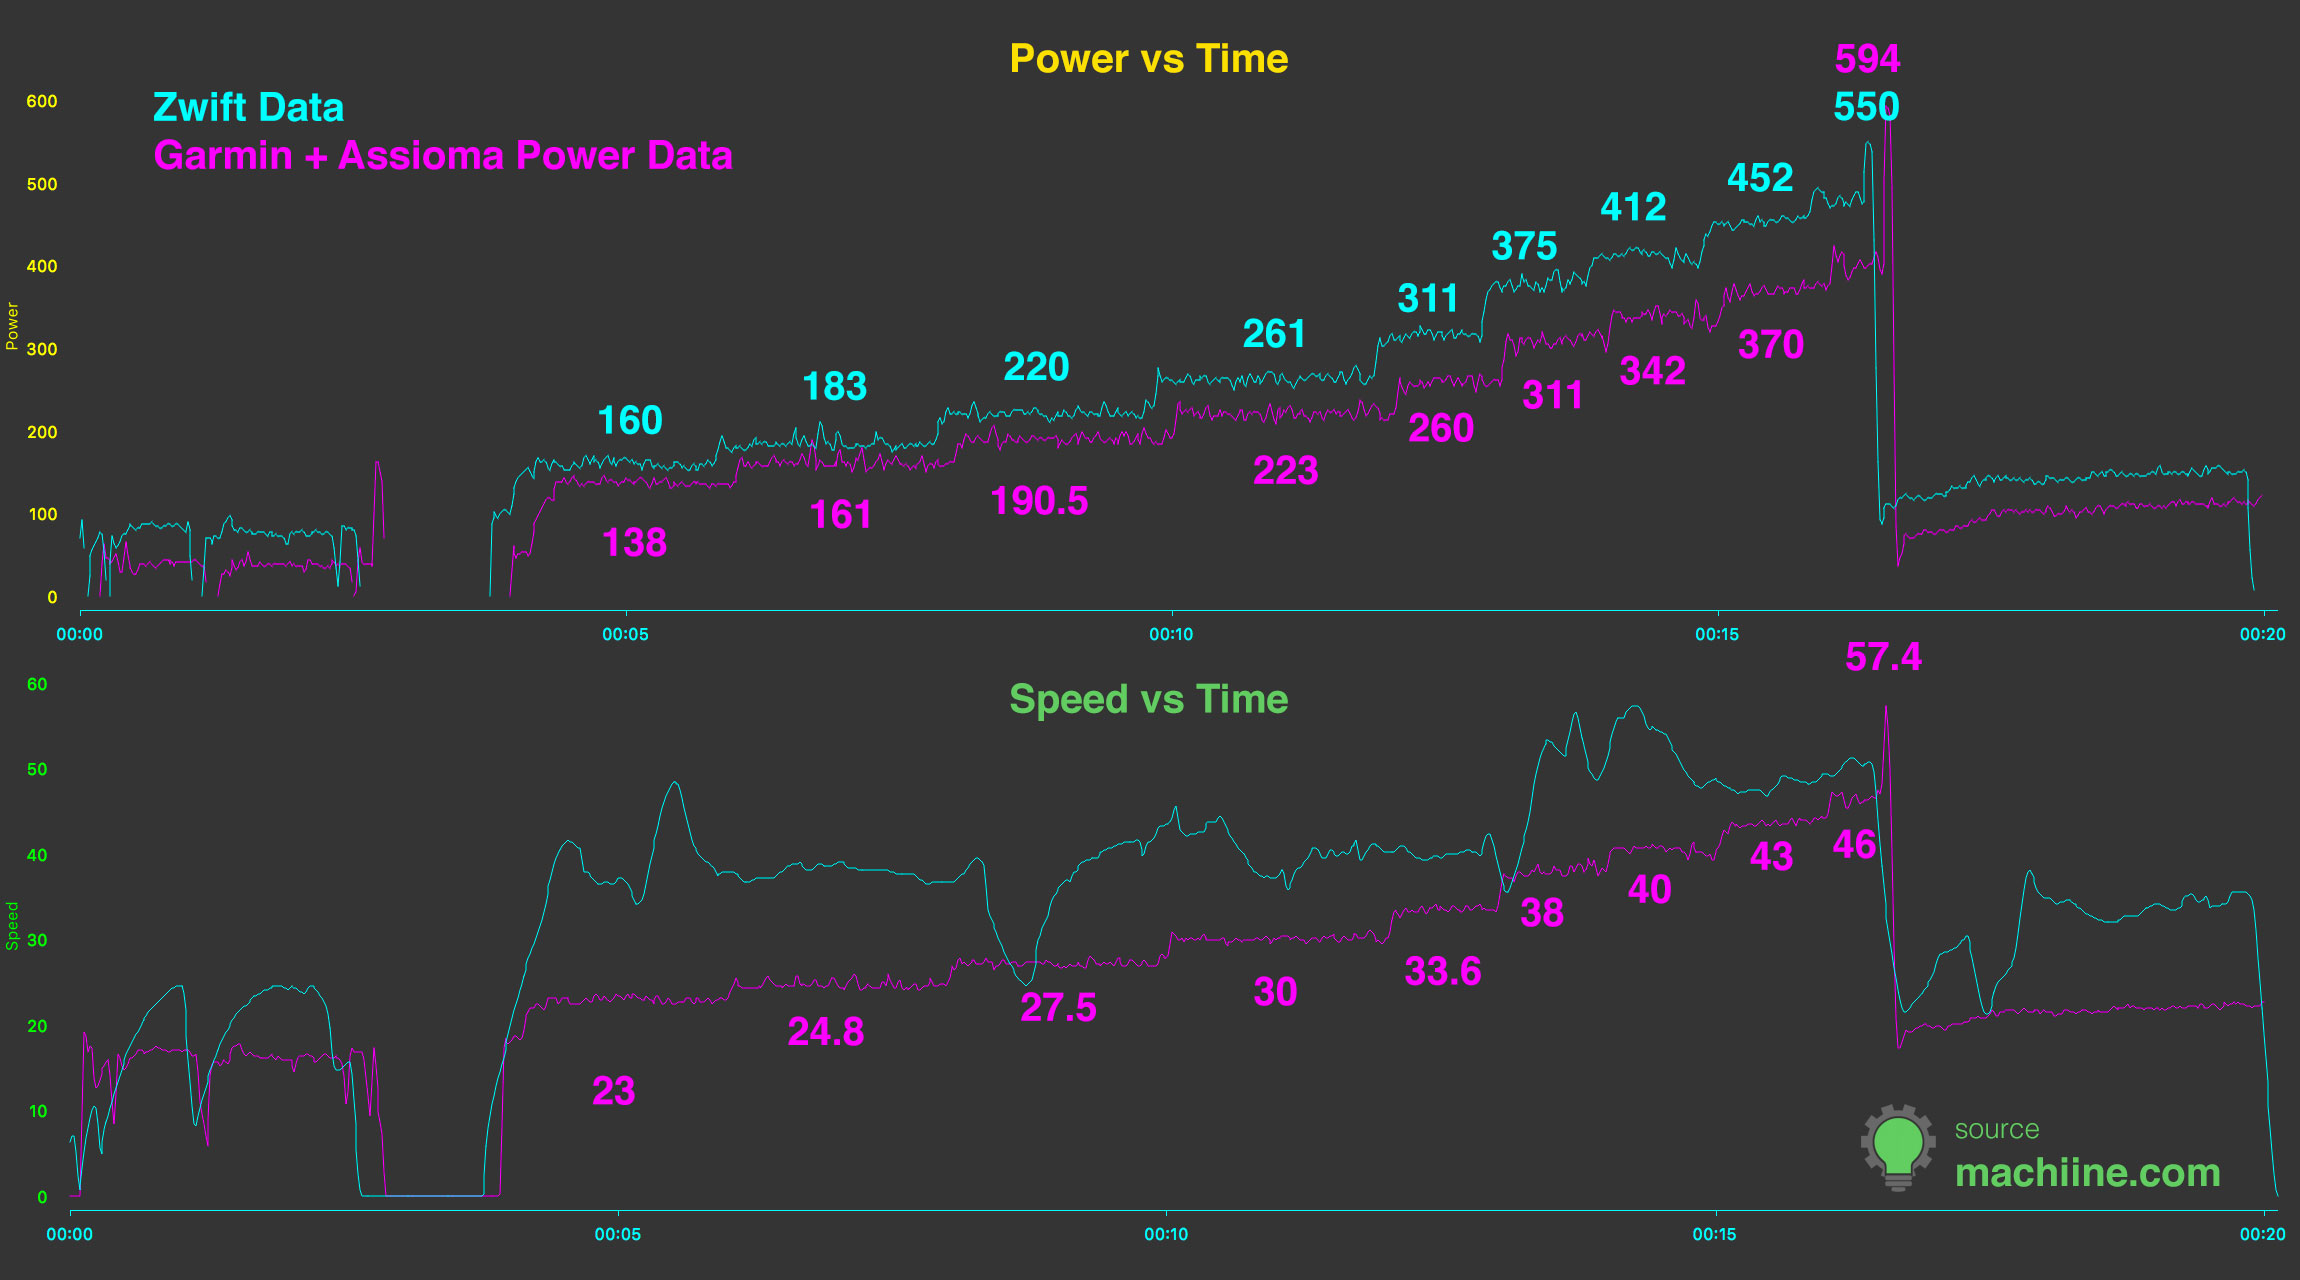
Power in Watts and Speed in Km/hr
I began using Zwift late last year for offseason riding. In a way, it is my winter group ride replacement. I use a classic magneto…
How to restore your Mac’s Apache settings after upgrading your Mac OS
How to get your virtual host MAMP Server (Mac Apache, PHP, and MySQL) up and running again after upgrading to the latest macOS. Mac High Sierra…